OEP-Q-Test Distribution of the score |
|
I added up tweet of OEP-Q-Test result. The mean is 58. The median is 58. 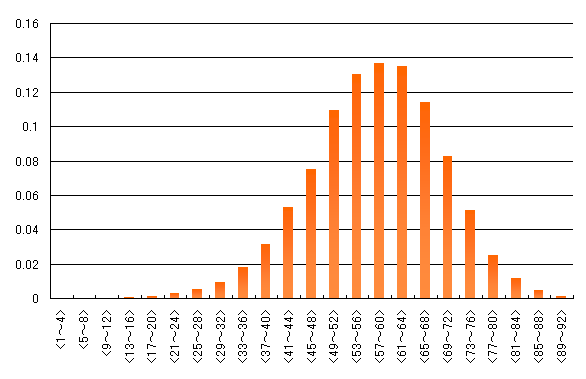 The horizontal axis corresponds to the score. The vertical axis corresponds to relative frequency[%] Count day:20120322-20
|
|
|
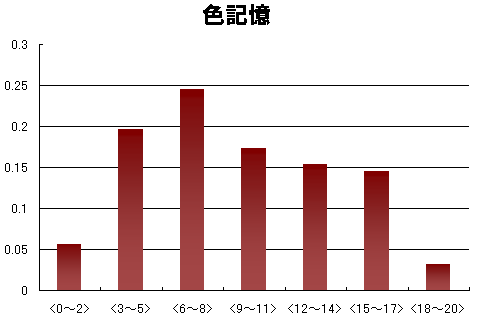
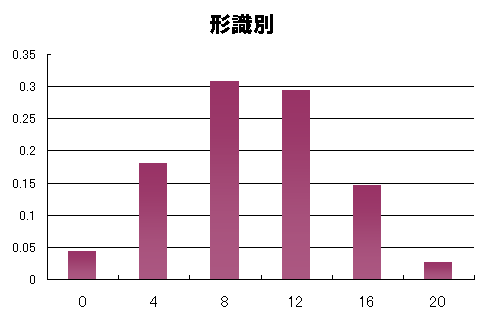
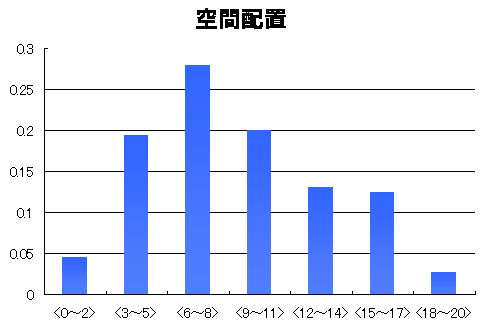
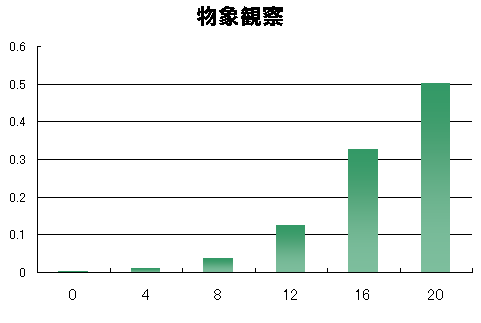
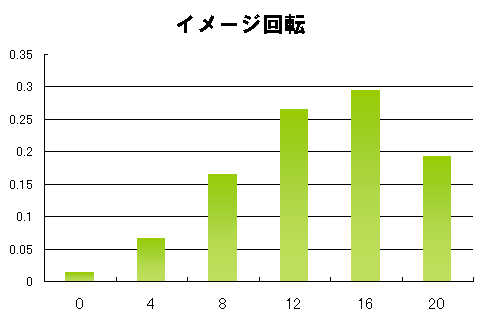
The following is statistics result according to the questions. |
|
Color memory
 Shape discriminability
 Space placement sense
 Object observation
 Mental rotation
 |
|
|
|
TraceTrainer train ability of the shape expression! 
|
AtarichanDrawer draw in every angle 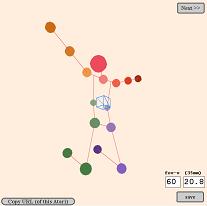
|
RupinRouter! draw lines at the right position! 
|